
Lost Sales
Bring lost sales back to specialist retail.
When shoppers look for an item on the brand website that no retailer near them has available, specialist retail loses revenue. Lost Sales makes these gaps visible and shows brands how much revenue in specialist retail goes untapped – and where. With these figures, the sales team plans reorders together with retailers. An add-on to Where-To-Buy.
Lost Sales in numbers
up to 60%
of lost revenue can be recovered
+115%
higher likelihood of a sale
< 14 days
to go-live as an add-on to Where-To-Buy
How Lost Sales works
Clear figures for every sales conversation.
Where-To-Buy records every product search on the brand website. If no retailer nearby has the item available, Lost Sales counts it as lost revenue. The tool shows how much market potential lies behind it – for the whole brand and for each retailer. In meetings, field sales reps show retailers exactly where the gaps in their range are and trigger targeted reorders.
in.outtra.com · Lost Sales
€68,642
Market potential
€2,989 (4%)
Lost sales in retail
466
Views
€204,549
Market potential, last 12 months
Market potentialLost sales in retail
Products in demand
 Eisbruch20 views
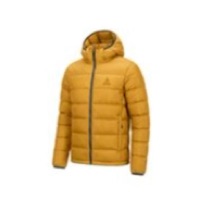 Firnkante14 views
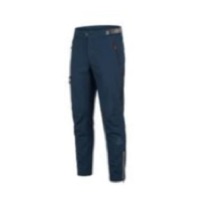 Felsrinne MTB12 views
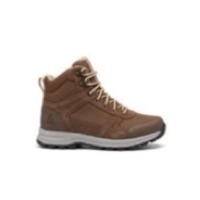 Rehsteig Mid11 views
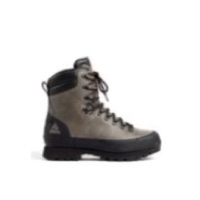 Keilerhang9 views
 Flussaue 36 views
Retailers
| Retailer | Views | Lost Sales |
|---|---|---|
| GlobetrotterStuttgart | 11 | €1,829 |
| SportScheckMunich | 14 | €1,564 |
| Sport ConradPenzberg | 6 | €642 |
Features
Know where revenue is lost.
Revenue
Lost revenue in euros
Lost Sales converts searches without an available retailer into lost revenue, based on the RRP.
Regions
Blank spots on the map
Lost Sales shows where shoppers search without any retailer having the item available – by postcode, city and radius.
Products
Item, size, colour
The dashboard shows every missing variant down to size and colour. That helps with reorders and season planning.
Planning
For sales and planning
The figures feed into the brand’s sales and season planning – as an export or directly in the analytics tool.
Search area
Know the revenue opportunities in every sales territory.
With a few clicks, you draw a search area on the map – such as a sales rep’s territory or an entire region. Lost Sales then shows the lost revenue for exactly that area. So everyone in sales sees at a glance where revenue is being lost in their own region.
in.outtra.com · Search area
The benefits at a glance
More revenue in specialist retail, less overstock in the warehouse.
For sales
- Lost revenue in euros, by region and retailer
- Real-time data for field sales and key accounts
- Distribute goods according to demand
- Win new retailers where demand goes unmet
For planning and warehouse
- Align availability with shopper demand
- Stock popular products down to size and colour
- Less overstock and tied-up capital
- Base season planning on real search data
Example calculation from the OUTTRA ecosystem
This is how much revenue Lost Sales brings back.
The starting point is the Where-To-Buy views on the brand website. Some of these searches find no retailer with availability. Lost Sales values exactly these searches at the average basket value. With targeted reorders, the brand brings part of this back into specialist retail – €44,500 in the example.
- 11,256
- Where-To-Buy viewsHow often shoppers search the brand website for a retailer near them
- 11%
- ConversionAverage share of views that lead to a purchase
- 60%
- Out-of-stock rateShare of searches without a retailer with availability
- €150
- Avg. basket valueAverage value of a purchase
- 40%
- Recapture rateShare that can be recovered
Recoverable revenue
€44,500
Views × conversion × out-of-stock rate × avg. basket value × recapture rate
The process
From a search without results to a targeted reorder.
Step 1
Shoppers want to buy locally
Shoppers choose a product on the brand website. Via Where-To-Buy, they look for a retailer near them that has the item available.
Step 2
No match
No retailer in the area has the item available. Lost Sales records this search as lost revenue.
Step 3
Demand becomes visible
Lost Sales bundles these searches: which items are missing where, how often and in which size.
Step 4
Take action
The brand gives retailers targeted reorder prompts, redistributes stock or wins new retailers where demand goes unmet. Automatic reordering is possible with Smart Replenishment.